Technical Analysis for Crypto Trading
Technical analysis is a method used by traders to evaluate and predict future price movements in financial markets, including cryptocurrencies, by analyzing historical price data and market statistics. This approach involves studying charts, patterns, and various indicators to make informed trading decisions. By understanding technical analysis, crypto traders can identify potential entry and exit points, manage risks, and enhance their overall trading strategies.
In this comprehensive guide, we will delve into the fundamentals of technical analysis for crypto trading, exploring key concepts, tools, and strategies that can help both beginners and experienced traders navigate the volatile crypto markets effectively.
Understanding Technical Analysis in Crypto TradingTechnical analysis focuses on interpreting price movements and trading volumes to forecast future market behavior. Unlike fundamental analysis, which examines the intrinsic value of an asset, technical analysis is rooted in the belief that historical price action tends to repeat itself due to market psychology.
Traders utilize various tools and indicators to analyze market trends, identify patterns, and assess momentum. By doing so, they aim to make informed decisions about when to enter or exit trades, maximizing potential profits and minimizing losses.
Key Principles of Technical AnalysisMarket Discounts Everything: All available information is already reflected in the asset's price.
Price Moves in Trends: Prices follow trends, which can be upward (bullish), downward (bearish), or sideways.
History Repeats Itself: Patterns and behaviors observed in the past tend to recur over time.
To effectively conduct technical analysis, traders employ a variety of tools and indicators that provide insights into market dynamics. Some of the most commonly used include:
1. Candlestick ChartsCandlestick charts display price movements within a specific time frame, showing the opening, closing, high, and low prices. They help traders identify patterns such as bullish or bearish trends.
2. Moving Averages (MA)Moving averages smooth out price data to identify trends over a period. The two main types are:
Simple Moving Average (SMA): Calculates the average price over a specific number of periods.
Exponential Moving Average (EMA): Gives more weight to recent prices, making it more responsive to new information.
RSI measures the speed and change of price movements on a scale of 0 to 100. Readings above 70 indicate overbought conditions, while below 30 suggest oversold conditions.
MACD is a trend-following momentum indicator that shows the relationship between two moving averages. It helps identify potential buy or sell signals.
Bollinger Bands consist of a middle band (SMA) and two outer bands representing standard deviations. They indicate volatility and potential overbought or oversold conditions.
Identifying Trends and Patterns in Crypto MarketsRecognizing trends and patterns is crucial for making informed trading decisions. Common patterns include:
1. Head and ShouldersThis pattern indicates a potential reversal. It consists of three peaks: a higher peak (head) between two lower peaks (shoulders).
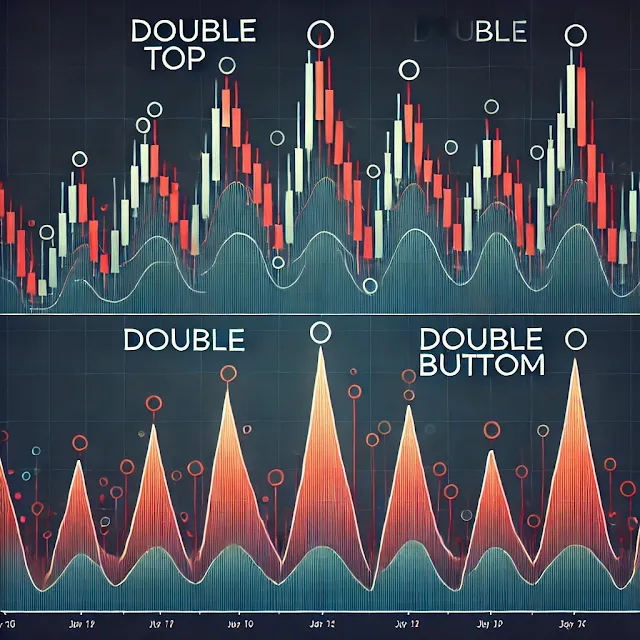
Double Top: Two consecutive peaks at the same level, suggesting a bearish reversal.
Double Bottom: Two consecutive troughs at the same level, indicating a bullish reversal.
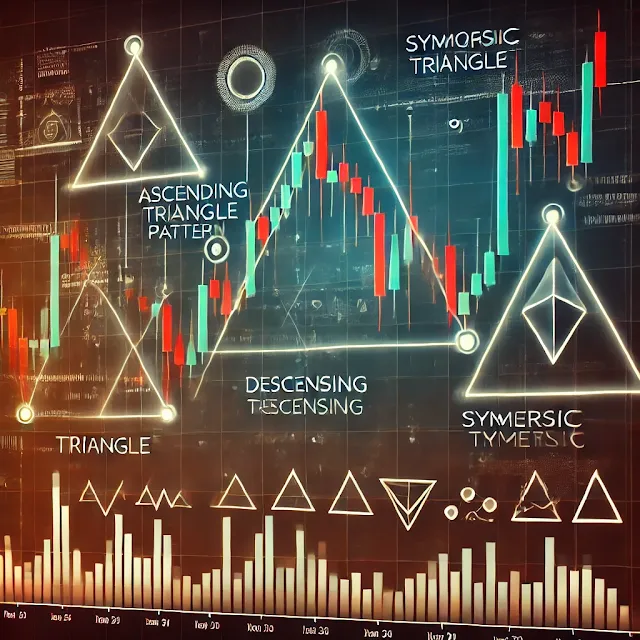
Ascending Triangle: A bullish pattern with a horizontal top and rising bottom trendline.
Descending Triangle: A bearish pattern with a horizontal bottom and descending top trendline.
Symmetrical Triangle: Indicates consolidation, with converging trendlines.
Applying technical analysis involves combining various tools and strategies to develop a comprehensive trading plan. Key steps include:
1. Setting Up Your Trading EnvironmentChoose a Reliable Platform: Select a trading platform that offers advanced charting tools and real-time data.
Customize Your Charts: Set up charts with preferred indicators and time frames.
Define Your Goals: Determine your risk tolerance and profit targets.
Select Indicators: Choose indicators that align with your trading style
#ACompleteGuide #technicalAnalysis #CryptoAnalysis #HowToDo #CryptoWallet #CryptoTrading


%20and%20Exponential%20Moving%20Average%20(EMA)%20lines%20overlaying%20the%20price%20ac.webp)
%20graph.%20The%20RSI%20line%20moves%20between%200%20and%20100,%20with%20overbought%20zones%20marked%20abov.webp)
%20indicator.%20The%20chart%20highlights%20a%20bullish%20crossover%20signal,%20wher.webp)
%20and%20two%20outer%20bands.%20The%20b.webp)


No comments:
Post a Comment
I genuinely appreciate you taking the time to read this blog post. Your support, comments, and engagement mean so much to me. Whether you’re here for the first time or have been following along for a while, I’m grateful to have you as part of this journey.
If you found value in this post, please consider sharing it or leaving a comment—your feedback helps me create content that resonates with you. Thank you for being a part of this community!
Warm regards,
Daily Boost Guide